Your progress:
What will you learn in this lesson?
After completing this lesson, you’ll be able to:
- Explain how to use the Gantt Chart.
Let’s set the scene.
 |
Layne is looking for a tool to visualize the website project schedule, including the ability to see dependencies between actions and how close each milestone is to completion. |
What is the Gantt Chart?
The Gantt Chart displays the Milestones, Actions, and Checklist Items for one or many Projects in a visual format. It is divided into three main areas as illustrated below.
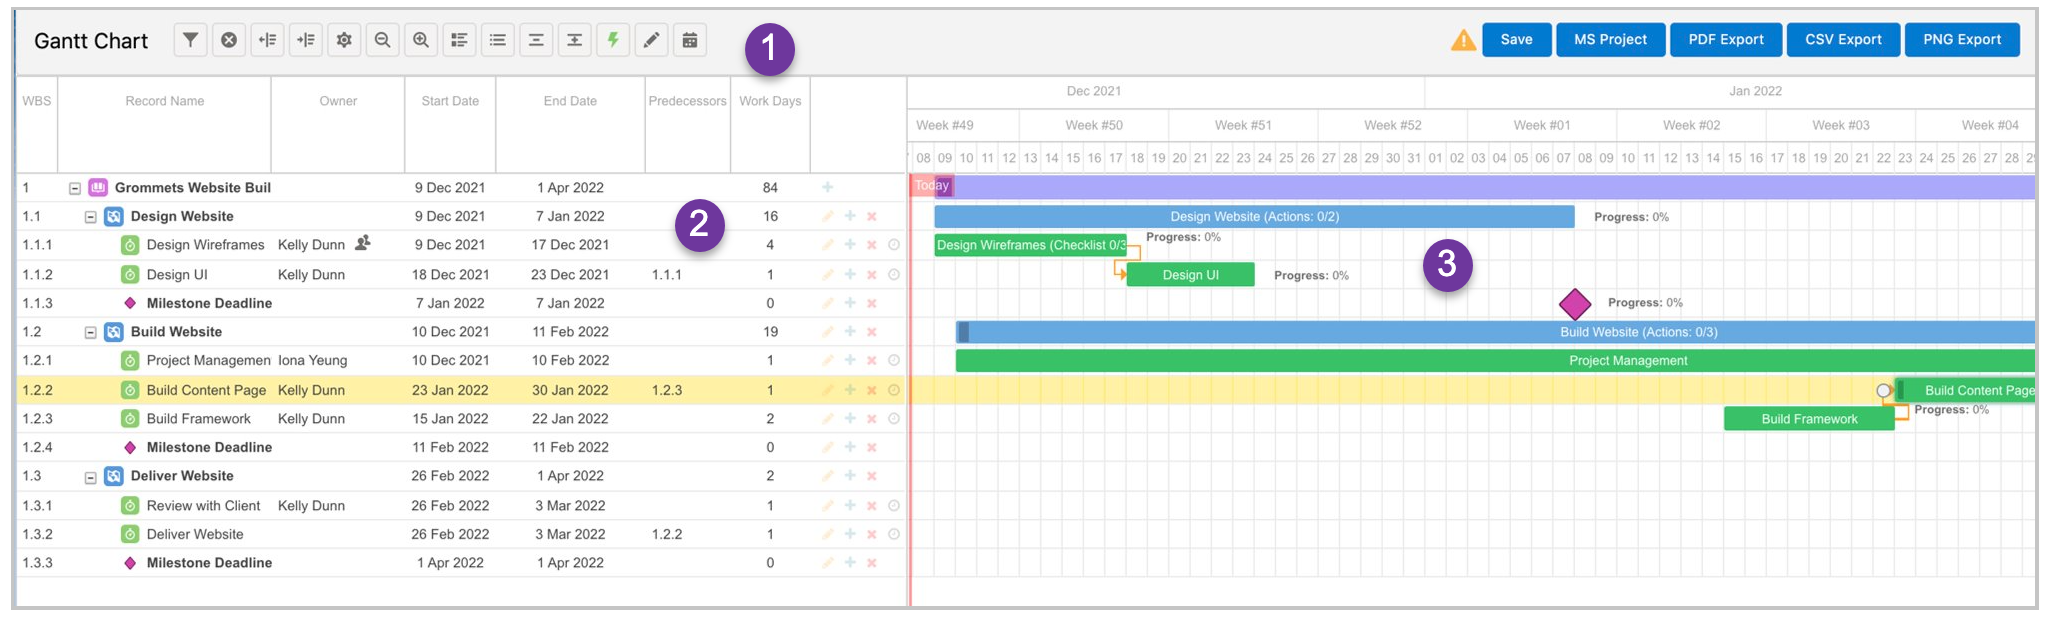
(1) Top section – icons and buttons to control settings on the Gantt Chart
(2) Grid – tabular view of the Milestones, Actions and Checklist Items
(3) Chart – timeline view of the Milestones, Actions and Checklist Items
Top section – icons
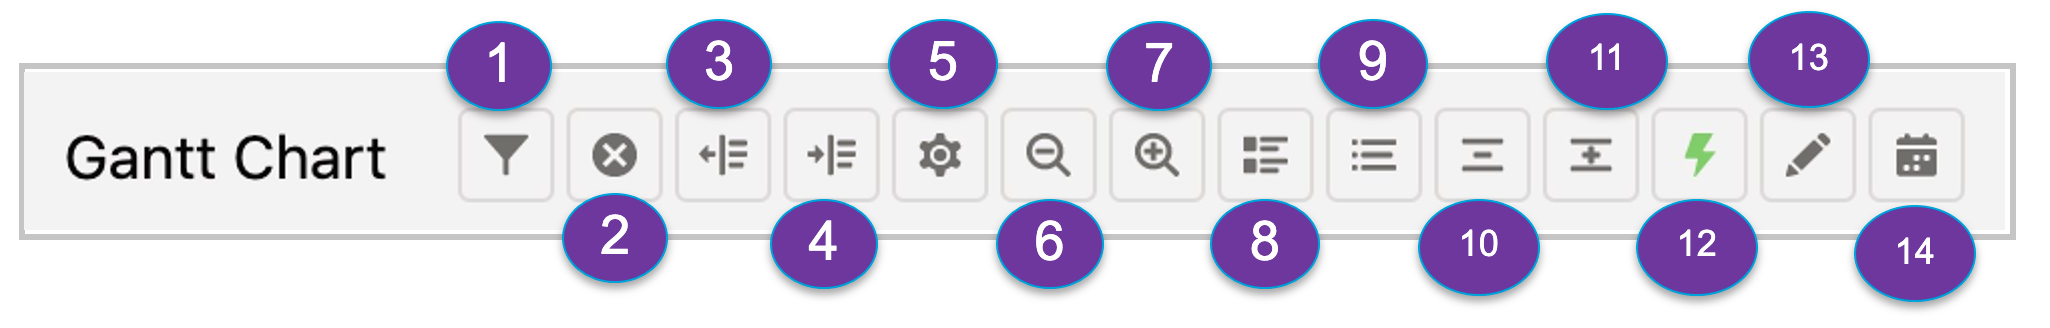
Features include:
(1) Apply filters to select the Projects you want to look at on the Gantt Chart.
(2) Remove all current filters.
(3) Collapse/expand the grid area.
(4) Collapse/expand the chart area.
(5) Select which fields you want to display in the grid area.

(6) Zoom out to make columns narrower.
(7) Zoom in to make columns wider.
(8) View/hide the baseline dates in yellow on the Gantt Chart.

(9) View/hide the Checklist Items.
(10) Collapse the Milestone and Action rows.
(11) Expand the Milestone and Action rows.
(12) Toggle on (green) and off (red) auto scheduling.
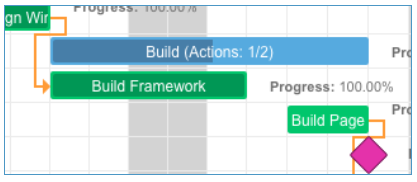
The ‘Auto Scheduling’ feature will automatically reschedule records when dependencies are created. For example, in the illustration below, there is a one day lag between the Build Framework and Build Page Content Actions.
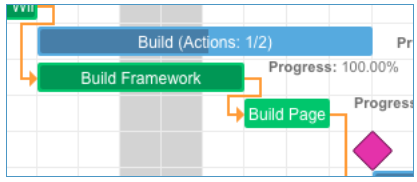
Once a dependency between the two Actions is created, in this instance a ‘Finish to Start’, the Auto Scheduling feature will automatically snap the child Action to start on the day following the completion of the parent Action, as shown below.
(13) Turn/on/off the Placeholder to use inline editing.
(14) Jump to Today within the Timeline
Top section – buttons

(1) Save – commit all unsaved changes.
(2) MS Project – export the Gantt Chart as an XML file that can be imported to MS Project.
(3) PDF Export – export the Gantt Chart as a PDF
(4) CVS Export – export the Gantt Chart as a CVS file
Allows you to specify a date range, add a custom heading and includes the option to export the baseline if applicable. See example PDF below.
![]()
Note: the PDF Export can be customized to add your own company logo and/or a client logo.
(5) PNG Export – export the Gantt Chart as a PNG file
Grid

Features of the grid area include:
- + – add new child record, for example clicking this icon on a Milestone record will add an Action record
- Pencil – edit the record
- x – delete the record
- Resize of the column width
Chart

Features of the chart area include:
- Double-click on an item to edit the record.
- View milestone deadline as a purple diamond. This appears when you enter a date in the Milestone Deadline field on the Milestone to view.
- Add an action dependency by using your mouse to connect the end of one action to the start of the dependent action.
- Remove an action dependency by double-clicking between two actions.
- Reschedule actions by dragging and dropping them to a new date in the timeline.
How do I access the Gantt Chart?
You are able to access the Gantt Chart in many ways. These include:
- Gantt Chart tab
- Project Detail page – scroll down
- Gantt Chart tab on a Project Overview page
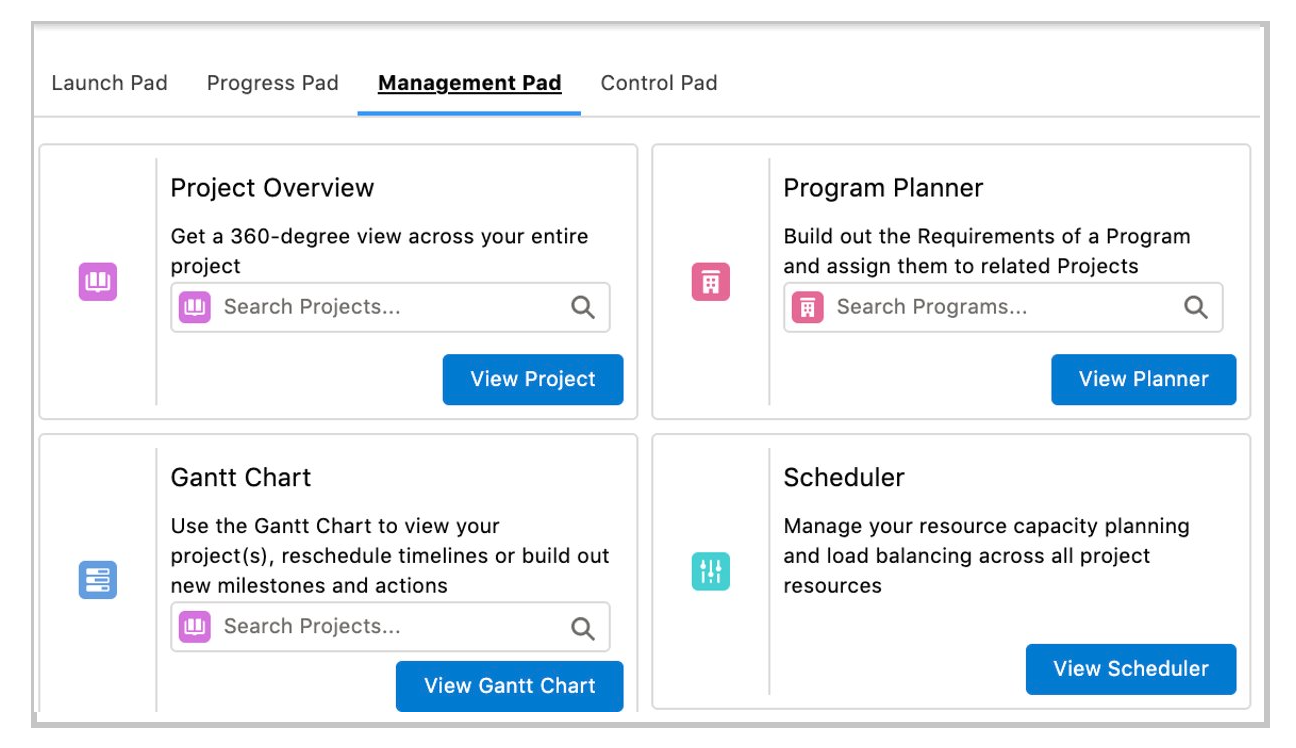
- Management Pad on the Mission Control Console
Before we move on…
Layne now understands how to use all features of the Gantt Chart and can’t wait to start using it on her next project.
Ready to move on? Take the quiz below to test your knowledge.
