Your progress:
What will you learn in this lesson?
After completing this lesson, you’ll be able to:
- Explain how to use the PMO Dashboard.
Let’s set the scene.
 |
Layne is looking for the ability to establish a variety of key performance indicators relating to her projects. |
What is the PMO Dashboard?
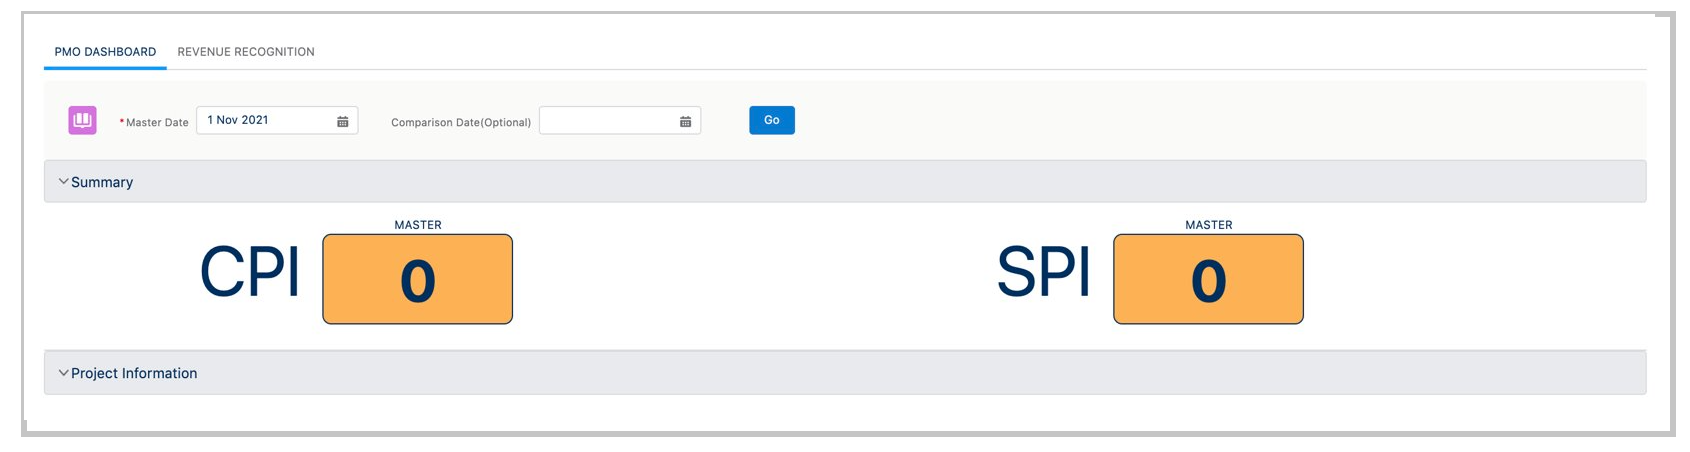
The PMO Dashboard provides you with the ability to establish a variety of key performance indicators relating to your projects, including:
Recognised revenue: This calculates how much of the revenue due to be earned has been recognized so far. If the Project’s Billing Type = Fixed Price, this is calculated based on Completion % * Hours Scheduled Value (Billable), otherwise it references the ‘Hours Completed Value (Billable)’.
CPI: This indicator identifies how the Project, Milestone or Action is performing against the scheduled revenue. The higher the score, the better you’re performing (e.g. you’re delivering the work more efficiently than you scheduled it to be delivered).
SPI: This indicator identifies how the Project, Milestone or Action is performing against the scheduled timeline. The higher the score, the better you’re performing. For example, you’re delivering the work quicker than it was scheduled to be delivered.
CPI / SPI breakpoints: The CPI and SPI values will be colored red, amber, or green based on the breakpoints you have set. These breakpoints can be set on the Mission Control Console Page in the ‘Project Automation’ section.
Note: the PMO Dashboard will only include Projects where the ‘Display on PMO Dashboard’ checkbox is ticked on the Project Detail page.
What if I want to compare two dates?
If you wish to compare two dates, enter a date in the Comparison Date field and click Load Dashboard.

How do I access the PMO Dashboard?
It’s easy! Here are the steps:
- Click the Mission Control tab.
- Click the Management Pad tab.
- From the PMO Dashboard tile, click View PMO Dashboard.
Before we move on…
Layne is now able to use the PMO Dashboard to establish and view a variety of key performance indicators relating to her projects.
Ready to move on? Take the quiz below to test your knowledge.
